|
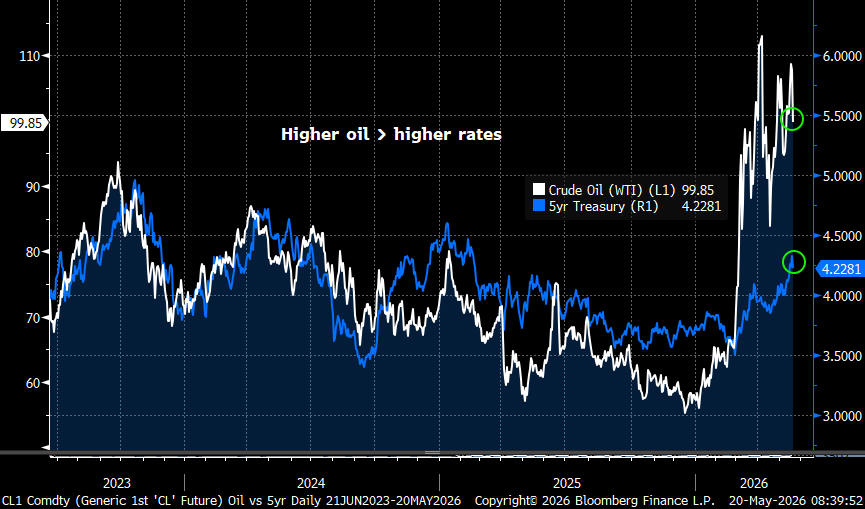
(5/20/26): Close to three
months into the Iran war and subsequent closure of the Straits of Hormuz, crude
oil prices (WTI) remain high, trading around a $100 per barrel. The 5yr Treasury
rates, along with the rest of the curve, hit 15 month highs.
(3/13/26): Higher crude oil
prices continue to push market rates higher. After a quick reversal from the
lows less than two weeks ago on Feb. 27 - the day before Operation Epic Fury -
the 5yr Treasury has re-entered the potential 3.76-4.00 range. What are the odds
market rates continue moving higher? Beyond the technical pattern suggesting
rising yields, if crude oil remains above $90 per barrel for an extended period,
the fundamental backdrop (rising energy prices adding to inflation) would also
support higher rates.
(1/16/26): The
5yr Treasury may have just broken out of a 5mo sideways 3.53-3.76 channel. If
3.76 can hold as new support, the next range could be expanded to 4.00.
(10/15/25): The trend of lower
5yr Treasury rates remains intact. As previously observed, it would take a significant move up in yield and time to assume any
reversal. In the meantime, the 3.60-3.40 area looks to be support.
(3/21/25): After lower highs at
each of three peaks on the 5yr Treasury over the past 18mos, the trend is pretty
clear. It will take significant moves up in yield and time to assume any
reversal. In the meantime, 3.80 looks to be reasonable support.
(1/30/25): After a break above
an intermediate downward trend formed from the October 2023 and April 2024
peaks, the 5yr Treasury looks to be resuming this trend. While there is still a
possibility for a run to 4.70 or higher, this looks less likely today.
(8/09/24): After reaching peaks
in Oct 2023 and April 2024, the 5yr Treasury rate returns to December 2023 lows
in anticipation of multiple Fed Funds rate cuts ahead.
(3/21/24): The recovery from
late January lows continues on the 5yr Treasury. It's still possible the 5yr can
hit 4.40. To go much higher, I would expect future inflation data needs to be
higher than expectations and the job market to remain strong.
(2/6/24): With last year's
strong �Bull Flag� pattern behind us, today�s market action looks like a
substantial base has developed at 3.80 with expanding higher highs forming a
megaphone pattern. We'll see how far this can carry, but with yesterday�s close
right at two prominent lows 4.11-4.12 (red line), August 8th and Dec 6th,
resistance may have been met and the rate may fall back to test 3.80 again.
(11/28/23): It appears the
"Bull Flag" pattern fully materialized. After reaching a peak near 5 percent (not
quite getting to the 5.20 target), the 5yr Treasury has retraced approximately
half the distance from the early June lows to mid-October highs (indicated by
the green dashed arrow). Going forward, the most probable scenario involves a
consolidation phase, with the likelihood of new highs appearing relatively low.
(6/29/23): The 5yr Treasury has
been developing a possible "Bull Flag" pattern. If correct, the next big move
may equal the length of the pole���.that�s a 5.20+
(11/29/22): The 5yr Treasury has
now recovered over 76 percent of its peak 2006-2007 rate of 5.23 back when the
Federal Reserve reached the 5.25 Fed Funds rate high.
(6/21/22): After a very brief
pause and pull-back at the October 2018 3.07 high, the 5yr Treasury rips higher.
The next potential resistance is the June 2008 3.76 high. After that it's all
air to 4.00-4.41. We'll have to see if the inflation data in the months ahead
keeps this rocket ship on its path.
(3/21/22): Again, using the
2015-2018 Fed Funds tightening cycle as a guide, the 5yr Treasury is
anticipating at least six rate hikes and is close to retracing 75 percent of the
entire move from the 2018 peak to the bottom in 2020. After a brief retest of
1.64 in early March, it's been straight up with no signs of consolidation at
this time.
(1/05/22): Using the 2015-2018
Fed Funds tightening cycle as a guide, the 5yr Treasury is closing in on
pricing-in at least four rate hikes when entering the 1.64-2.00 range. It�s also
worth noting that 1.64 is the 50 percent retracement of the entire move from the
2018 peak to the bottom in 2020 and further suggests that 1.64 is a reasonable
level to buy the 5yr.
(10/21/21): The 5yr Treasury
hit the 76 percent retracement mark to pre-covid levels last seen in early February
2020. Eventually, there will be a run to 1.50 (and beyond), but like
other big moves as this, there�s typically a period of consolidation that
follows.
(5/18/21): Once the 38 percent retracement
level was breached, the 5yr Treasury
rate quickly consolidated around 0.83, the top of the first 0.68-0.83 target.
From here, the next retracement range is 0.98-1.16 and likely touching 1.20 in
the months ahead.
(2/18/21): The 5yr Treasury
rate finally broke out of its 11 month 20-50bps range. This sets-up a reasonable
target of 0.68 � 0.83 over the next weeks/months, a 38 to 50 percent retracement
of the whole covid-impact move.
(6/29/20): The 5yr Treasury
hits another all time new low.
(3/30/20): The 5yr Treasury
hits an all time new low. Is this the bottom? Once the corona virus spread
subsides, and with the slew of Federal Reserve liquidity measures and when the
$2tril+ fiscal stimulus kicks in, sure could be.
(3/04/20): Fear of the negative
economic impact caused by the spread of the coronavirus sent rates to historic
lows. The 5yr Treasury broke through significant 1.32 percent technical support,
then cut right through the 2016 Brexit low of July 2016 following the emergency
50bps Funds rate announced 3/03 by the Fed to levels not seen since 2012-13.
(11/07/19): Potential for
higher rates as the 5y now sits at 1.73 (June lows and Sept high). If the market
can close above 1.73-1.75, there�s a good chance 1.80-2.00 is next.
(8/13/19): So far in 2019, all
major and minor support levels for 5yr Treasury
have been broken. The next possible area area for support is the 1.40-1.50 area.
Any further down from there would have to be the June 2016 low in 2016 at 1.00.
(6/10/19): The 5yr Treasury
rate broke through 2.00 intermediate support on a sharp and fast 40bps decline
from mid-April. It now looks like a wider range of lows is possible for the
remainder of 2019, essentially the range seen in 2017 with attempted runs to
highs close to 2.40.
(4/25/19): The 5yr Treasury
rate continues to probe for a new intermediate range. After hitting breakdown
lows in late March, the subsequent rebound shows resistance is likely in the
2.50-2.60 area. Lower support should be around 2.00.
(1/30/19): The 5yr Treasury
rate fell through 2.60 support in late December as equities tumbled, testing
2.35 on January 3rd. After briefly rising to 2.60, rates once again fell with
Fed comments shifting to "patience" about future rate hikes, removing its
previous reference to a gradual stance.
(12/14/18): After taking a
brief run above 3.00, the 5yr Treasury
rate has pulled back to the middle of its 2018 range. Support should still be
about 2.60, but this could easily be broken if equities continue to fall and the
market starts to price-in fewer or no Fed rate hikes for 2019.
(10/23/18): The 5yr Treasury
rate pierced through previous 2.94 resistance and should now offer some support
at this level. As for the next resistance, 3.25 looks to be a likely target that
dates back to December 2007.
(6/15/18): The late May retest
of previously identified support and consolidation around 2.60, so far, seems to
be holding. As for resistance, 2.94 (the high in 2009 and mid-May 2018), looks
to be the next level to beat.
(3/06/18): After an incredible
surge in rates from early September to late March, the 5yr Treasury should at
least consolidate in the current area around 2.70-2.50. Though several key
support areas still appear valid should rates look to retest previous launching
pads such as 2.09, 1.80, even 1.22.
(10/10/17): The 5yr Treasury
has rebounded to the previous May and July intermediate highs, halfway between
the longer-term 1.80 support and 2.10+ resistance areas.
(8/11/17): With recent worries
over potential military action against N. Korea, the flight-for-safety trade of
buying U.S. Treasuries has pulled the 5yr rate back down below 1.80 support.
(3/21/17): The multi-year
major level of 1.80 was solid resistance from 2013 until it flipped to support
after the election. Now in a new range, the low 2.30�s could be a potential high
resistance for the 5yr Treasury this year. That said, the extreme expectations
reflected in the Trump-train stock market rally (currently Dow 20,905), may be
short-lived. If a substantial equity market correction was to occur in the
weeks/months ahead, it's very possible 1.80 support could be violated, sending
the 5yr Treasury rate to 1.50, maybe even back to 1.00.
(1/05/17): Spike high patterns
in the 5yr Treasury have occurred the past several years with most of them
lasting just a couple weeks before reversing to retest their origins. Does that
mean the recent meteoric rise in the 5yr Treasury will collapse to 1.20? Who
knows. But at least this historic pattern suggests some potential
pull-back�..soon.
(11/14/16): Quite a sensational
blast through several resistance levels, the 5yr Treasury rockets through 1.40
and 1.60 in just 4 sessions, possibly challenging multi-year major resistance of
1.80. My take is while 1.80 may be hit in the days/weeks ahead, some back and
filling should occur, possibly bringing the 5yr back down to 1.40 before
year-end.
(11/05/16): The 5yr Treasury rate moved solidly back into its
multi-month upward sloping channel. This pattern points to an eventual test of
1.40. Of course, all bets are off if/when equities sell-off sending buyers
clamoring for Treasuries and high quality fixed income.
(7/19/16): Following the anticipated drop to 1.00 spurred on
by the Brexit vote and disappointing employment data in late June/early July,
the 5yr Treasury now begins an important test back to the 1.12-1.15 area. This
level has been critical multi-year support. Today, the big question is will this
area now become hardened resistance? Or just temporary and rates resume the
previous multi-year channel (1.20-1.80)? My belief is the answer still points to
the stock market. If stocks continue to set new highs, rates will ultimately
rise. But, if you think as I do, the stock market is way over-due for a severe
correction and a bear market ensues, rates go lower to the next target, 80bps.
(4/08/16): Still trading in a three year range between
1.80-1.15, the 5yr Treasury once again faces a possible break down toward the
50bps lows of 2012..........or another run back toward 1.80. Most certainly the
outcome will be determined by the direction of equities.
(10/20/15): Down we go. Outside of 2 days in mid-September,
the 5y Treasury downward channel is intact. While 1.00 is the most likely
outcome in the months ahead, don�t doubt a few bounces will be potential buying
opportunities. Possibly reaching 1.50 on any sizable rally in the stock market.
But all will be short lived. The way-over-due stock market correction is here
and will very likely develop into a tremendous bear market.
(6/05/15):
The 5yr treasury rate
pushed through a 9mo old downward channel trend�s upper band.
While a test of the multi-year high of 1.80 is probable, I still wouldn�t rule
out 1.00 on a way-overdue equity market correction.
(10/14/14): Significant rate support was broken today across
most treasury issues. It is now very possible the 5yr will test 1.00 or lower
over the next several months.
(1/08/14):
The 5yr treasury rate is
making another run at intermediate resistance currently at 1.74. The big
question is can rates break through this intermediate six year downward sloping
resistance and go higher? Obviously, one answer could be yes. But, my take is
this just another test in the bigger picture of lower rates ahead. Another
thing. Since the majority of market pundits believe rates can only go
higher�..well, we�ve seen over and over, history is filled with outcomes that
are much different than majority consensus.
(9/09/13): Here's an update to the long-term channel trend of
the 5yr treasury you might find useful. The chart shows the clear trend down in
rates (really goes back to 1982) with the last 4 months showing a substantial
move back up to a level which could be labeled intermediate resistance
(1.70-1.80).
(7/23/13): After blowing through the previous mentioned
120bps ceiling, the five year treasury continued it's meteoric rise to
longer-term resistance dating back to July 2011. As the markets attempt to
discount both economic recovery and potential tapering of quantitative easing,
we should expect no less than extreme volatility. It's probably best to raise
top resistance to 200bps (hit multiple time in 2009 -2011), while realistically
assuming a 100bps floor.
(6/06/13): Enduring 13 months of an excruciatingly narrow 60-80bps
trading range (including a brief foray to 90bps), the five year treasury finally
broke it's shackles into what could be a brand new trading range. Looking back
to spike highs in Nov. 2011 and again in March 2012, the next ceiling could be
the 120bps level, making the floor or support 90bps.
(4/02/13): Back to the shackles. After a breakout above the
60-80bps prison ceiling, the five year treasury tested 90bps a couple times,
before being hauled back to the jail. The hope would be the equity market's
continued bull run would give another boost to rates. But, I'd more worry about
a very, very over-do stock market correction (the longest multi-year gain
without a 20 percent or greater correction since 1929!), which would no doubt
bring rates down with falling stock prices.
(01/31/13): Breakout! Finally, the 9 month shackle of
60-80bps trading range has been broken.
(11/08/12): The 5yr is holding true to the 80bps resistance
and 60bps support range.......basically put in place the last 6 months. In my
humble opinion, there's not much that can cause a move out of this band until
there's a clearer direction in the equity markets (which are primarily waiting
for DC to address the fiscal cliff, now that the election is over and of course,
how Europe handles its own woes). I still believe a substantial stock market
correction is likely, which doesn't bode well for higher rates.
(09/07/12): After a bit of a long hiatus updating this 5yr
technical chart, it's nice to see we haven't hit zero yet. But, sure feels like
we've been close. July found us at a multi-generational low of 54bps, followed
be a sharp rise (typical of any bear market) then only to drift back down to
what looks like intermediate support around 60bps.
(08/18/11): No sooner did I write that the 5yr treasury
couldn't possibly trade for any length of time below 1.00, the FOMC minutes
released the following day told us the Fed will effectively be committed to
ultra-low rates for at least the next two years, sending treasury yields across
the curve, crashing down. Today the five year treasury trades below 90bps,
helped by concerns of further European bank and sovereign debt crisis, a general
worldwide slow down and fears of a US double-dip recession. At this point, it might be
safe to say zero would be as low as it could go.
(08/08/11): Following the historic downgrade of US government
debt by S&P, the five year treasury is probing for support around the early
November 2010 low of 1.03. Unless panic selling in equities continues (Dow -635
today), it's hard to imagine the five year treasury trading for any sustainable
period below 1 percent.
(04/19/11): Post a failed run to higher rates and subsequent drop
back to near-term support in the low 2.00's, the five year treasury range looks likely
to bounce between the mid-March 1.82 low and the 2.25-2.35 area until there is
either a significant stock market correct or change in fed policy.
(2/28/11): Five year treasury rates test near term resistance of 2.25-2.35, with
a spike high of 2.40. Currently, the 5yr is consolidated toward 2 percent
support (same level was resistance, see previous post), readying for the next big test if
rates hold here. It's fairly easy to technically see if rates fall below 1.90,
there's a good chance we're back in the 1.50 area again. On the upside, if
further consolidation over the next several weeks occurs at or above the
2.00-2.14 area, major support will be confirmed and higher highs would be
expected.
(12/10/10): A resurgence in inflation fears, rising deficits and a general risk
appetite for stocks versus bonds has sent the 5yr treasury yield up over 80bps
in just four weeks. Strong overhead resistance is 2.00. If this level is broken,
next stop would be around 2.25-2.35.
(8/17/10): As expected in the last observation three months ago, we came within
points of reaching 10,700 Dow on August 9th. But did surging equity prices send
rates higher? Surprisingly, no. It appears there's a winner-take-all death
battle going on between the equity market's optimism for economic recover and
the bond market's fear of a slow down or worse, double dip recession. Which
scenario wins? We'll find out soon enough. Personally, I'd trust the bond
markets prediction as seen. It's always been the best economic indicator,
particularly the shape of the yield curve. As it's flatted over the last few
weeks, it too is a sign for tougher times ahead. The five year treasury is
currently in the low 1.40s, which looks like major support. That said, sometime
within this fundamental economic downshift lasting many years, and most likely
the decade, I'd expect a yield around 1.00 to be the ultimate bottom.
(5/24/10): Lots of D's: deflation, de-leveraging (excluding sovereign debt),
fear of a global double dip recession/depression and issuer default, send safe
heaven treasuries rates to lows seen only a couple times since the financial
crisis began. The "safety" trade may only lift with a clearer move up in the
equity markets. This author's bet is the Dow will trade into the 8k's later this
year, bringing rates down further. But, like all major market moves, this will
not happen in a straight line. I'd expect at least another run up to test 11,300
Dow (at least 10,700) before a dive later into autumn or late summer.
(2/16/10): For now, the 2.00 level is holding and not withstanding some
really, really bad news out of left field, looks like the 2.35 area is offering
the more realistic support. Overhead resistance remains around 2.75.
(10/07/09): The trend in the five year yield has general been higher lows over
the last 10 months. But, recent attempts at new highs have meet considerable
resistance. The concern (if you are looking for higher rates) is a
potential break below 2.00. Certainly, if the economy continues to expand at or
above market consensus, the upward trend should remain.
(6/05/09): Fueled be a better than expected jobs report, the five year breaks
through 2.50 resistance. Look for some base building between 2.50 - 3.00 before
a push to 3.50 or higher in the months ahead.
(3/18/09): The upward channel trend continues, suggesting higher rates ahead.
(2/03/09): An encouraging technical signal for better rates ahead......higher
lows and higher highs since mid-December 2008.
(12/12/08): Five year treasury rates have plummeted through 2.00 support levels
like the proverbial hot knife through butter. Now at levels half of where we
were just four month ago, I find it hard to believe buyers will continue to be
happy earning 1.67 percent on five year paper.
(10/08/08): The flight to treasuries and financial market Armageddon continues. Similar to the 2yr chart pattern, a double
bottom has formed, favoring higher rates ahead.
(8/12/08): Similar to the 2yr chart pattern, good technical support has been
building over the last 4 months. This suggests a move from the low 3.00 area
back to 3.75 resistance. Of course it's never in a straight line. If you are a
buyer, I'd
look for higher rates before committing to longer term securities.
(6/13/08): Onward and upward. A break above 3.50 should keep us on track to 4.00
as the curve regains a steeper slope (due to inflation worries). But as noted on
the 2yr treasury chart update page, this probably won't be in a one move. I'd
expect a consolidation around 3.25-3.50 before advancing higher.
(5/01/08): An upside down head and shoulders pattern formed over the last four
months, giving a high confidence confirmation the 5yr should find it's way back
to 3.50, then on to 4.00 over the next several months.
(4/08/08): Finally, looks like we've reached a bottom in five year treasury
rates around the 2.30 area. It wouldn't surprise me if 3.50 is hit within the
next few quarters as credit markets stabilized and the "hording" of treasury
securities unwinds..
(3/03/08): While five year treasuries stabilized for most of February, the final
week of the month rates break to levels not visited since July 2003.
(1/22/08): Five year treasury rates have fallen an astonishing 50% over the last
seven months as investors gobble up treasury securities regardless of price.
With levels not seen in four years in an over-bought treasury market, and with
today's emergency 75bps Fed Funds cut, I would
expect some base building over the next several weeks.
(10/29/07): A possible double bottom around 4.00 may be indicating the 5yr
treasury rate has set a low for the year. As mentioned in previous posts, the
fundamentals of the US economy remain strong, despite the worries over sub-prime
mortgages and housing in general.
(7/27/07): After hitting a spike high of 5.20 on June12, rates drop back down to
a consolidation range between 5.10-4.90 for several weeks. Then comes a stock
market correction, sending rates spiraling down to major support, now seen at
4.43. As noted on the 2yr treasury chart update page, this is not a good level
to lock in rates (but is for the borrower!)
(6/15/07): Like a hot knife in butter, the five year treasury rate goes
through 4.88 resistance. Next stop 5.12? I have to say "eventually", since the
economy's fundamentals are very strong due to strong family spending
demographics (consumer spending = 70% of GDP!). But, after any big move in a
short period of time, I would expect some consolidation. Probably around 5.00
for several weeks.
(5/16/07): While not as technically clear as the 2 yr chart pattern, the
4.63 level appears to be minor resistance. A break above 4.70 should see us back
towards the 1/29/07 high of 4.88. On the low side, 4.50 support should hold.
(4/16/07): After holding the December 5th low of 4.38, the five year treasury
rate rebounds again towards 4.80 resistance.
(3/2/07): This is same pattern as the two year treasury. In a flight to quality
caused be equity market correction, five year treasuries dive back down to the December 5th low of 4.38.
(1/23/07): Since the recent December 5th low of 4.38, rates have rebound to 4.80
resistance. If we break above 4.80, the next resistance level is 4.90 (matching
the mid-June 2006 consolidation level).
(1/08/07): A sharp decline to the 4.38 level occurred in just a few days
after the 11/27/06 observation. But just as quickly, rates rebound to 4.70,
taking with it the possibility of testing January 2006 lows. Currently, the
short-term resistance area is around 4.80 (similar to the 2yr treasury).
(11/27/06): A struggle to maintain levels above 4.63 suggests further
weakness to 4.25 (January 2006 lows) is highly probable.
(10/27/06): Resting right on top of the support line of this multiple
year upward channel, the five treasury rate tests 4.63 support.
(9/29/06): The five treasury rate goes through previous 4.68 support,
and remains slight below the upward channel trend line.
(9/07/06): We hit 4.68 on 9/1, which is very close to major
support. Higher rates ahead? If this 36 month upward channel is to stay intact,
then YES!
(8/18/06): The 5 year treasury rate hit a 5.23 high on 6/26 and has
subsequently set lower highs through July. This may indicated rates have
peaked for the near term. Major support is around the 4.65 level.
(6/20/06): Jury is not out. The 5 year rate barely pokes up above
resistance.
(5/30/06): Major multi-year resistance holds at the 5.00-5.10 area.
(4/28/06): Similar to the 2yr treasury rate, major multi-year resistance
continues to hold at the
4.90-5.00 area.
(4/4/06): The 5 year treasury rate continues it's march to major resistance
at 4.90-5.00.
(3/2/06): We are closing in on a major multi-year resistance level in the
4.90-5.00 area, which is the top part of the 25 year downward channel. This is
also true for the 10 and 30 year treasuries as well.
(2/6/06): The large and quick move predicted in the previous posts has
occurred. The five-year treasury should now move in a consolidated pattern
with resistance in the 4.90-5.00 area. Support moves up to 4.40-4.50.
1/13/06): The triangle pattern observed several weeks ago has now developed
into a "bull flag" pattern. Flag patterns represent brief pauses in a
dynamic market. They are typically seen right after a big, quick move.
The market then usually takes off again in the same direction. Research
has shown that these patterns are some of the most reliable continuation
patterns.
(12/20/05): A triangle pattern continues to form in text book fashion. The next
big move is usually a breakout in the direction of the long-term trend. In this
case, up.
(12/2/05): Almost identical to the 2yr chart, near term range is 4.30-4.56.
(11/21/05): Similar to the 2yr chart, we may have completed a double or even
triple top pattern.
Near term resistance is 4.56.
(11/03/05): After breaching the previous near-term resistance level of 4.33, the
5yr treasury rate continues in it's upward channel pattern established in 2003.
Next resistance level is 5.00.
(10/13/05): Close to new highs, the 5yr treasury tests near term resistance.
(9/20/05): The 5yr treasury continues trading in the 3.98- 4.33 range.
(9/2/05): With a convincing break below 3.98, the wider trading range is now
3.63- 4.33 range, and minor support at 3.80.
(8/25/05): The 5yr treasury continues trading in the 3.98- 4.33 range.
(8/03/05): We've sliced convincingly through intermediate resistance of 4.00. The
new range is 3.98-4.33
(7/18/05): Broke through minor resistance at 3.90. Next challenge is
4.00
(7/6/05): A short term channel has developed between 3.63-3.90.
(6/22/05): Major support holds at 3.63. But, it's possible we have
developed a "head and shoulders" pattern over the last 6 months.
If this holds true, a break below 3.63 could take us to 3.30.
(6/8/05): Well, the possible spike low I wrote about earlier actually became
3.63. Now we're back to 3.72 which should make 3.63 major support.
(5/25/05): Another attempt at 3.80 minor support. There is no technical evidence
that new rate highs won't be reached later this year.
(5/18/05): Very benign inflation data allows the 5yr rate to drop below 3.82
support. If you are looking to sell longer paper (at a high price), this could
be the time.
(5/04/05): The 3.82 support level continues to hold. While this powerful upward
channel should guide us to new highs around 4.50 sometime this year, we can't
rule out the possibility of a temporary spike low to 3.70.
(4/14/05): Finally, a significant correction in yield brings us back toward
support. The 3.82 level should hold, but I wouldn't rule out a possible spike
low to 3.70 before we see new highs later this year.
(3/29/05): At 4.30, we are getting close to the level I would expect some pull
back in yield. Nothing moves in a straight line. Range remains 3.82-4.40.
(3/10/05): We sliced through 4.09 resistance without much hesitation. This takes
us to a new range of 3.82-4.40.
(2/28/05): No pull back........yet. New recent high at 4.00 makes the
June 14, 2004 record of 4.09 the next near term resistance.
(2/24/05): At 3.86, we're trying to knock through resistance to new 7 month
highs. But, I wouldn't be surprised to see a pull back to the 3.60 area before
making this attempt.
(2/11/05): Resistance is holding at 3.80-3.85. Consolidation around 3.70.
(1/28/05): Resistance is holding at 3.80-3.85.
(1/10/05): We should be approaching some slight near term resistance at
3.80-3.85.
(12/28/04): This text book perfect upward channel chart continues to show us
rates are going up.
(12/17/04): This is a very powerful upward channel trend. You can see it shouldn't take long before we're challenging the 4.00+ level again.
(12/7/04): Even with another clear signal from the VIX index that stocks should
correct a min. 3-5%, and rates would most likely follow, we would have to close
below 3.25 to change the clear long term direction...........rates up.
(11/24/04): We're right at 3.60 resistance. Not if, but when this is taken out,
the next target will be 4.10.
(11/18/04): Near term resistance holds at 3.60. But, similar to the 2yr chart,
there's no problem identifying the longer term trend.....rates up.
(11/08/04): A surprisingly good employment report sends rates rocketing close to
3.60 resistance. Support remains at 3.00.
(10/25/04): The short-term downward channel trend is getting closer to meeting
the 3.00 battle line. Again, without a more significant stock market
correct (Dow 9000), major support should remain at 3.00.
(10/15/04): Still within it's bands, the downward channel in rates continues.
But, as seen in this chart update, the longer term trend (rates up) should
confine any drop in the 5yr to 3.00.
(10/8/04): After trading a few sessions above the top line, which indicated a
break out, the 5yr dives back into it's downward channel on today's disappointing
jobs data.
(9/29/04): Still not challenging a break out to higher rates as seen in the 2yr
chart. The 5yr remains in it's downward channel. A break above 3.50
is needed to confirm a new trend of higher rates.
(9/21/04): With a successful hit at 3.25 and no upward attempt to breakout of
this channel, the 3.00 level remains the challenge.
(9/10/04): This powerful downward channel continues to be very convincing 5yr
rates are headed lower. The 3.25 is an easy target to hit, with the real test at
3.00.
(9/3/04): A powerful downward channel should keep a heavy lid on any advance
above 3.60.
(8/20/04): Again, lower rate lows and lower rate highs over the last 3 months form a
very clear down channel picture. It might be very good advice to buy the
5yr now or hope for a best level of 3.60 and buy with both hands and feet!
(8/12/04): Now the 3.60 area becomes intermediate resistance.
(8/6/04): Just like last months disappointing jobs data, the July numbers
show only 32k vs the expected 240k new jobs. The intermediate support battle at
the 3.60 level is now over. Next challenge/support is 3.00 (please read previous
posts).
(7/27/04): The 3.60 intermediate support stays intact. Although lower peak
highs June-July is pointing in the direction of lower rates ahead. What a
battle.
(7/21/04): The 3.60 intermediate support still looks vulnerable even after a
successful test at 3.54 (one day close).
(7/7/04): With the first of the markets highly anticipated fed moves
behind us and a disappointing June jobs report released last Friday, medium to
long term rates drop substantially. The 5yr 3.60 support level has been tested.
It is possible that we could see a full 50% retracement of the 12 month move in
rates from 2.00 (June 03) to 4.00 (June 04). The 3.00 level also culminates at
the pinnacle of 6 month symmetrical triangle.
(6/18/04): The range remains 3.70-4.50, with the 4.00 area a most probable
average as we wait for the June 30 FOMC.
(6/10/04): We've pushed through 4.00 intermediate resistance. Next ceiling
looks like the 4.50 area. Support is raised to 3.70.
(5/27/04): While 3.60 offers intermediate support, I wouldn't rule out a pull
back to 3.50 (38% retracement of the +138bps move from 3/24-5/13).
(5/18/04): Support at 3.60 should hold, with temporary resistance at 4.00.
(5/10/04): The last observation below was clearly wrong. April's job data
confirm treasury buyers will demand higher and higher rates. Minor resistance at
4.00. Strong resistance not until 5.05 (high set in May, 1991).
(4/28/04): The 3.60 resistance level keeps a lid on advancing
rates.
(4/21/04): Eventually we'll need to challenge 3.60 with the likelihood of a
Fed tightening. The 3.20 level remains strong support.
(4/19/04): It's easy to see the ultimate near-term 3.60 resistance. We seem
to be settling in the intermediate 3.45 area. Don't rule out a temporary pull back to 3.20, or
even 3.00. That said, a year from now, it will be a different story. I'd
plan on 4.50+ when the Fed's will most likely be in a tightening cycle.
(4/12/04): A repeat of similar rate rises we witnessed in last year's
July/August period?
(4/5/04): As seen in the 2yr chart, we blew by 3.00 resistance in one day and
now challenge the 3.20 area. But, it's not clear we can continue higher without
first attempting a pull back, possibly to 3.00.
(3/29/04): We've broken through 2.80 intermediate resistance (intra-day as of
this writing). While this can offer a reasonably good technical buying level,
3.00 would be ideal. If you've been waiting for an
excuse to do some buying, this could be it.
(3/24/04): As seen on the 2yr chart, we remain in a narrow range that suggest
better buying would be towards 2.80, while holding off closer to 2.60 support.
But, bear in mind that in the not too distant future, we will ultimately break
out of this complacent range, up to 40 basis points above or below
2.80-2.60.
(3/17/04): 2.60 support continues. Minor resistance at 2.80.
(3/10/04): 2.60 support test to come. Minor resistance at 2.80.
(3/5/04): Fundamentally, hard to believe we would see the technically
predicted break-out move down. But, as observed in the developed
"descending
triangle" pattern of the last several months, high probability
was given to this decline in rates. As of this writing, the 5yr is below the
2.80 Oct 1, 2003 low and below the apex of the last developed triangle pattern
completed April 29, 2003. That leaves us with the next intermediate support
level of 2.60 (major support 2.00).
(3/4/04): As stated below........it's coming.
(2/26/04): Get ready for a break-out, as we approach the apex of this
"descending
triangle" pattern.
(2/20/04): 2.96 continues to hold offering good support. But, a possible
"descending
triangle" has developed. Does this mean rates are headed lower?
Check out the link in the previous sentence.
(2/12/04): Good support at 2.96 with minor resistance remaining at
3.20-3.25
(2/04/04): Support is holding at the 2.96 level. Minor resistance at
3.20-3.25
(1/29/04): Greenspan drops "considerable period" phrase signaling
to the market they can raise rates sooner than later.
(1/27/04): Intermediate support is building at the 2.96 level.
(1/21/04): Intermediate support at 2.96? To confirm this, it would be encouraging
to see a successful test and bounce from this level.
(1/13/04): Next support at 2.80 (Oct. 1, 2003 low).
(1/7/04): Breaking out of the symmetrical triangle pattern? Hard to believe,
put if this is a true break-out, the 5yr could reach the low 2's. (????)
(1/7/04): Looks like we're continuing to build a symmetrical triangle pattern
(over the last 4 months) with 3.20 as the base.
(12/29/03): Very indecisive. The only thing to say (which is not very
helpful) is the big picture range maintains 2.80-3.60.
(12/12/03): Did we "take out" support for the move to higher
rates?
(12/10/03): Big move coming. Also seen in the 2yr chart, it's getting hard to
deny that the next big move is up.
(12/1/03): A break out of a symmetrical triangle pattern? If so, we could
see 4.00 within Q1 2004.
(11/26/03): While not as clear as the ascending triangle seen in the 2yr
chart, it's not too difficult to outline the building of a symmetrical triangle
pattern.
(11/19/03): Resistance 3.40-3.45
(11/14/03): We need to hold 3.09-3.20 to maintain the current symmetrical triangle
pattern.
(11/7/03): Again, similar to the 2yr chart, this break out could result in a
substantial move up. The new target looks like 3.80-4.00 over the next several
months.
(11/4/03): Similar to the 2yr chart, a symmetrical triangle (characterized as areas
of indecision) is forming. Research has shown that symmetrical triangles overwhelmingly
resolve themselves in the direction of the of the previous medium and/or long
term trend.
(10/28/03): We could be setting up a symmetrical triangle, as we did in
March-April.
(10/20/03): Again, until we see at least a 10% correction in equities, 2.80
is solid support.
(10/14/03): Without a meaningful correction in equities, 2.80 is the floor.
(10/03/03): Nothing like a good employment report to turn things around (+57k
vs. -25k expected).
(9/30/03): Getting close to 2.80..........on just a 1% correction in
equities!!! Just imagine what a reasonable 15-20% correction will yield.
2.00-2.20????
(925/03): Next stop 2.80? With a possible 15-20% correction in
equities......it's very likely.
(9/15/03): Support in the 3.00-3.10 area.
(9/8/03): Last Friday's unemployment report has the market rethinking higher
rates. Support should be around 3.00
(8/15/03): Still testing major resistance. If we break above 3.45, there
isn't much technically to stop us from going to 4.00. Since we are in a bear
bond market, eventually we will go though 4.00. But, then again, with Fed Funds
at 1.00, I doubt it can happen without a Fed tightening.
(8/8/03): Like the 2yr, we should have seen the high rates for the
summer. Major resistance has now been confirmed in the 3.35-3.45 area.
(8/1/03): It's been 6 weeks since the June 13th low of 2.03. We should
find resistance in the 3.35-3.45 area.
(7/28/03): Closes at 3.14 (above major resistance)
(7/24/03): Major resistance at 3.08, minor support 2.86
The following technical observation is provided by http://www.chartpatterns.com
|