|
|
 |
|
|
 |
| |
The
Robinson Report |
A quick
and simple weekly
market performance report.
|
Friday,
November 25, 2005
|
|
![]() |
| |
Week
in review:
-
After
Fed Action - Whenever the Fed
raises interest rates numerous times, there is the possibility that
their action could lead to a "hard landing" for the economy.
For instance, the first two quarters following seven Fed rate hikes in
1994-95 showed annualized GDP growth of +1.1% and +0.7%. The economy
quickly recovered and produced average annualized GDP growth of +4.3%
over the next 20 quarters.
-
Short
Up, Long Down - The Fed has raised
short-term interest rates 12 times since 6/04. On 6/30/04, the
yield on the two-year Treasury note was 2.70% versus 4.62% on the
ten-year Treasury note. Today, the yield on the two-year note is 4.32%
and the yield on the ten-year note was 4.44%.
-
Five
In A Row - All major equity indexes covered in this report made
gains for the 5th straight week. The S&P 500 index (including dividends)
is now less than 4% away from posting double digit returns for 2005. Beating
the index, the Aggressive Growth portfolio just
hit over 10% total return for the year.
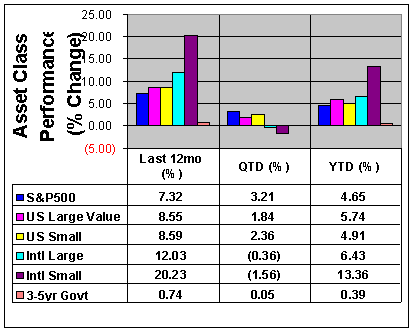
ASSET
CLASS RETURNS 

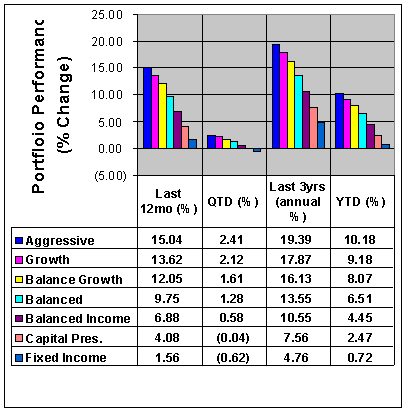
Portfolio
Performance REVIEW

|
|
| |
| |
"Forever is composed of nows."
-- Emily Dickinson
|
|
|
|
|
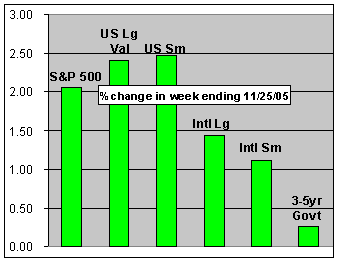
% change in week ending 11/25/05 |
|
S&P500 |
2.05 |
|
US Lg Val (Russell 1000 Value) |
2.41 |
|
US Sm (Russell 2000) |
2.46 |
|
Intl (EAFE) |
1.44 |
|
Intl Sm (EAFE Small) |
1.11 |
|
3-5yr Treas (Bloomberg) |
0.26 |
|
|
|
|
|
|
|
% change
|
|
Bloomberg Silicon Valley Index |
|
Last 12 months |
13.29 |
|
YTD |
10.37 |
|
Last 5 sessions |
2.55 |
| |
|
|
% change
|
|
Global Hedge Fund Index (11/23/05) |
|
Last 12 months |
2.94 |
|
YTD |
1.14 |
|
Last 5 days |
0.94 |
CONTACT
US
RCM Robinson Capital Management LLC
27 Reed Blvd, Mill Valley, CA 94941
Tel: 1.415.771.9421
Fax: 415.762.1980
Email
|
| |
|
|
|
Portfolio
Performance is calculated by the Bloomberg
Professional System on a total return basis.
Current
portfolio allocations
|
|
|
|
|
Important Performance Disclosure Information
|
|
Portfolio
Performance is the total return of seven
unique asset allocation strategies
that seek to fit the distinct needs of different investor goals,
risk tolerance levels and investment time horizon. Each
portfolio contains up to 16 individual funds totaling over 4000
securities, managed by OppenheimerFunds.
The portfolios are
designed to create efficient diversification through the
selection of lower correlating asset classes.
The purpose of these tables and charts is
for you to follow specific market indexes, observe asset class
rotation and to compare actual portfolio returns.
Portfolio Performance is the total return of
seven unique asset allocation strategies that seek to fit the
distinct needs of different investor goals, risk tolerance
levels and investment time horizon. Each portfolio contains up
to 16 individual funds totaling over 4000 securities, managed by
OppenheimerFunds.
The portfolios are designed to create efficient diversification
through the selection of mutual funds that may have a low
correlation between asset classes.
The purpose of these tables and charts is for you to follow
specific market indexes, observe asset class rotation and to
compare actual portfolio returns net of management fees.
Asset allocation strategy is available
here.
Before
investing in any of the
OppenheimerFunds, investors should
carefully consider a fund's investment objectives, risks,
charges and expenses. The fund's prospectus contains this and
other information about the fund. Read prospectuses
carefully before investing.
|
|
| S&P 500 - Standard & Poor's 500 Index (not
including dividends) - generally considered a U.S. Large Growth
company market index. |
|
Russell
1000 Value Index (US Lg Val) - generally considered a U.S.
Large Value company market index. |
Russell 2000 Index (US Sm)- generally considered a U.S.
Small company market index. |
|
EAFE - EAFE Index (Intl) (not including dividends) Europe,
Australia, Far East and generally considered a large company
international market index. |
|
EAFE Sm - EAFE Small Index (Intl Sm) (not including dividends)
Europe, Australia, Far East and generally considered a small company
international market index. |
|
Bloomberg Silicon Valley
Index - market index of high tech companies located in the Silicon
Valley area. |
Global Hedge Fund Index - representative of the overall
composition of the hedge fund universe. It is comprised of eight strategies:
convertible arbitrage, merger arbitrage, equity hedge, equity market neutral,
relative value arbitrage, event driven, distressed securities, and macro. The
strategies are asset weighted based on the distribution of assets in the hedge
fund industry.
See hedge
fund risks. |
|
3-5yr Treas. - Bloomberg U.S. Government Treasuries
3-5 year maturities index and generally considered a intermediate
maturity U.S. Government Note index. |
|
All investments involve
risk, including loss of principal. Foreign securities involve additional
risks, including foreign currency changes, political changes, foreign
taxes, and different methods of accounting and financial reporting.
The
foregoing has been prepared solely for informational purposes, and is not
an offer to buy or sell or a solicitation of an offer to buy or sell any
security or instrument or to participate in any particular trading
strategy.
The information contained herein is based on
sources and data believed reliable, but is not guaranteed. Advisory
services offered through RCM Robinson Capital Management LLC, SEC
Registered Investment Advisor. Securities offered through Securities
America, Inc., Member FINRA/SIPC. Douglas C. Robinson, Registered
Representative. RCM Robinson Capital Management LLC and Securities
America, Inc. are separate and unaffiliated.
|
|
|
|
|
|
|