|
|
 |
|
|
|
| |
The
Robinson Report |
A quick
and simple weekly
market performance report.
|
For the week of October 27, 2006
|
|
![]() |
| |
Week
in review:
-
The Markets
�
Prior to a fall back on Friday
after the Commerce Department issued a gross domestic product reading
tempered by housing market concerns, the Dow had set a new high close
every day last week and in 13 of the previous 18 sessions. For the
week, the Dow rose 0.73 percent to 12,090.26. The S&P climbed 0.66
percent to end at 1,377.74, and the NASDAQ gained 0.36 percent to
close at 2,342.30.
-
Fed Stands Pat
� At its meeting last week, the Federal Reserve stuck to its
guns and left interest rates unchanged. The overnight federal funds
rate has been at 5.25 percent since June 29, when the Fed ended its
string of 17 consecutive increases that started in 2004 to keep
inflation in check..
-
Jet Demand Helps Manufacturing Sector Soar �
The Commerce Department reported last week that
durable goods orders climbed 7.8 percent in September, with most of
that growth coming from a 183.2 percent increase in orders for
commercial planes. Excluding transportation, durable goods grew just
0.1 percent. The gain is the biggest since June 2000.
-
Many Up Months �
Eight of the first nine months in calendar year 2006
have produced a positive total return for the S&P 500. Only May (down
2.9 percent) was not an up month for the stock index this year. The
last time that eight of the first nine months during a year were up
for the S&P 500 was in 1996, a year that finished with a 23.0 percent
total return. Through September 30, 2006, the S&P 500 was up 8.5
percent YTD.
-
I
Think I Will
�
Although more than
six out of every eight working Americans (77 percent) believe they
will continue to work in some capacity even in their retirement years,
only one out of every eight currently retired Americans (12 percent)
is working for pay.
-
Sticking To The
Plan �
The median 401(k) account balance almost doubled (up 98
percent) for employees who maintained participation (and continued to
make pre-tax contributions) in their company�s plan over the 5 years
from December 31, 2000 to December 31, 2005. The average 401(k)
account balance was up 51 percent during the same period. The S&P 500
averaged only a +0.5 percent total return per year over the 5 years.
-
Budget Results �
The U.S. government spent $1.10 for every $1.00 collected in fiscal year
2006 resulting in a $248 billion budget deficit, a $71 billion
improvement over the previous fiscal year.
Featured article:
Preplan Your 2007 Health Care
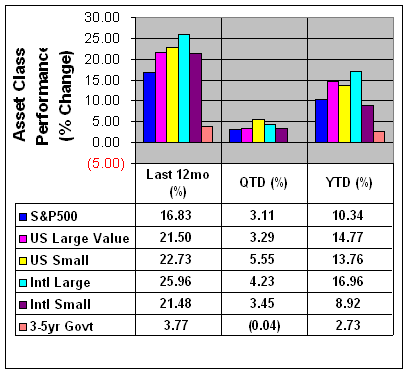
ASSET
CLASS RETURNS (see disclosures below) 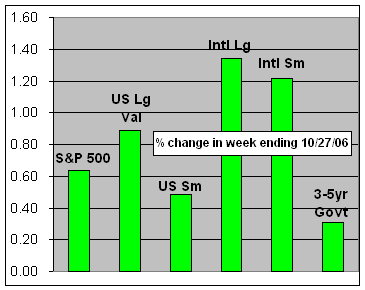
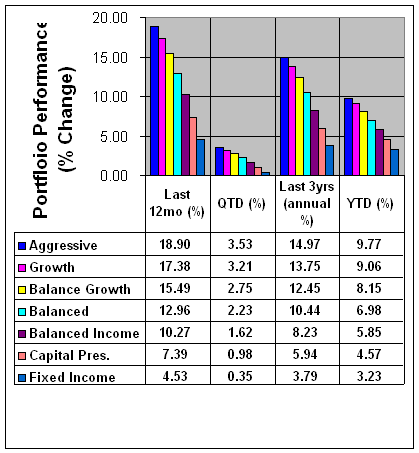
Portfolio
Performance REVIEW (see disclosures below)
|
|
|
Subscribe/Unsubscribe |
| |
"I
couldn't wait for success, so I went ahead
without it."
--Jonathan Winters
|
|
|
|
|
% change in week ending 10/27/06 |
|
S&P500 |
0.64 |
|
US Lg Val (Russell 1000 Value) |
0.89 |
|
US Sm (Russell 2000) |
0.49 |
|
Intl (EAFE) |
1.34 |
|
Intl Sm (EAFE Small) |
1.21 |
|
3-5yr Govt (Bloomberg) |
0.31 |
|
|
|
|
|
|
|
|
|
|
Important Performance Disclosure Information
|
|
Asset
Class returns are represented by market indexes that are
unmanaged baskets of securities. Investors cannot directly
invest in market indexes. Foreign securities involve additional
risks, including foreign currency changes, political risks,
foreign taxes and different methods of accounting and financial
reporting.
Portfolio Performance is the total return of
seven unique asset allocation strategies that seek to fit the
distinct needs of different investor goals, risk tolerance
levels and investment time horizon. Each portfolio contains up
to 16 individual funds totaling over 4000 securities, managed by
OppenheimerFunds.
The portfolios are designed to create efficient diversification
through the selection of mutual funds that may have a low
correlation between asset classes.
The purpose of these tables and charts is for you to follow
specific market indexes, observe asset class rotation and to
compare actual portfolio returns net of management fees.
Asset allocation strategy is available
here.
Performance
quoted is past performance and cannot guarantee comparable
future results. Performance figures reflect reinvestment of
distributions and changes in net asset value (NAV). Investment
return and principal value will vary so that you may have a gain
or loss when you sell shares. The contingent deferred sales
charge (CDSC) on Class C is 1%. No CDSC will be imposed on redemptions
of Class C shares following one year from date shares were
purchased. Performance shown does not include applicable CDSC,
which would have reduced performance.
Before
investing in any of the
OppenheimerFunds, investors should
carefully consider a fund's investment objectives, risks,
charges and expenses. The fund's prospectus contains this and
other information about the fund. Read prospectuses
carefully before investing.
|
|
| S&P 500 - Standard & Poor's 500 Index (not
including dividends) - generally considered a U.S. Large Growth
company market index. |
|
Russell
1000 Value Index (US Lg Val) - generally considered a U.S.
Large Value company market index. |
Russell 2000 Index (US Sm)- generally considered a U.S.
Small company market index. |
|
EAFE - EAFE Index (Intl) (not including dividends) Europe,
Australia, Far East and generally considered a large company
international market index. |
|
EAFE Sm - EAFE Small Index (Intl Sm) (not including dividends)
Europe, Australia, Far East and generally considered a small company
international market index. |
|
Bloomberg Silicon Valley
Index - market index of high tech companies located in the Silicon
Valley area. |
Global Hedge Fund Index - representative
of the overall composition of the hedge fund universe. It is
comprised of eight strategies:
convertible arbitrage, merger arbitrage, equity hedge, equity market
neutral, relative value arbitrage, event driven, distressed
securities, and macro. The strategies are asset weighted based on
the distribution of assets in the hedge fund industry.
See hedge
fund risks. |
|
3-5yr Treas. - Bloomberg U.S. Government Treasuries
3-5 year maturities index and generally considered a intermediate
maturity U.S. Government Note index. |
|
Asset Class - a group of
investments that share similar risk and return characteristics. |
|
All investments involve
risk, including loss of principal. Foreign securities involve additional
risks, including foreign currency changes, political changes, foreign
taxes, and different methods of accounting and financial reporting.
The
foregoing has been prepared solely for informational purposes, and is not
an offer to buy or sell or a solicitation of an offer to buy or sell any
security or instrument or to participate in any particular trading
strategy.
The information contained herein is based on
sources and data believed reliable, but is not guaranteed. Advisory
services offered through RCM Robinson Capital Management LLC, SEC
Registered Investment Advisor. Securities offered through Securities
America, Inc., Member FINRA/SIPC. Douglas C. Robinson, Registered
Representative. RCM Robinson Capital Management LLC and Securities
America, Inc. are separate and unaffiliated.
|
|
|
|
|
|
|